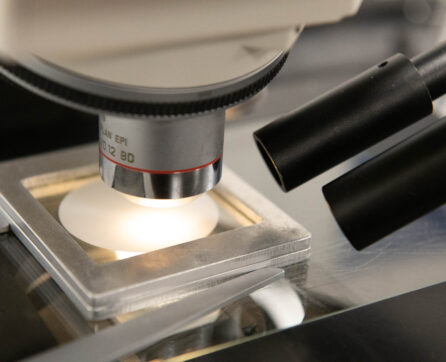
Particle size analysis – also called particle size measurement or particle sizing – is a range of methods used to measure the size, shape and distribution of particles in a given sample. At Particle Technology Limited, we offer various particle size analysis methods, as detailed below.
The technique selected will depend on the type, physical state and quantity of the sample to be tested, from bulk samples to particulate present on a filter, generated from activities such as stack emissions monitoring. Different techniques yield different results due to their limitations and the physical principles employed with each method, so the type of analysis chosen will also take into account the information you require.
Particle size analysis is a vital form of testing in many sectors, including the automotive, military, pharmaceutical, construction and food industries. The process can be applied to determine the efficiency of a manufacturing process, the performance of a final product, to identify contaminants, and more. While some methods can be used for a wide range of samples, other apply to specific applications. The methods and equipment employed by Particle Technology include:
In order to ensure the ongoing accuracy and proficiency of our equipment, and yours, Particle Technology offers a range of particle size standards for calibration, validation and testing. We also provide sample analysis to characterise particles found.
Laser diffraction analysis – or laser diffraction spectroscopy – measures particle size distributions by utilising diffraction patterns of a laser beam passed through any object. Large particles scatter light at small angles relative to the laser beam and small particles scatter light at large angles. The angular scattering intensity data is analysed to calculate the size of the particles responsible for creating the scattering pattern.
Horiba LA-950 and Microtrac S3500.
0.1–3000 microns.
1) All particles are spherical; 2) all particles are of the same density.
Particle size from laser diffraction is reported as equivalent spherical diameter – this is the diameter of a sphere that diffracts light in the same way as the particle being measured. Data is generally given in volume %, both differential (the amount at each size) and cumulative undersize (the amount below the stated size).
The electrozone sensing method works by passing a small current between two electrodes submersed in electrolyte and separated by a small orifice (typically 30 to 400 microns diameter). The sample is added to the electrolyte solution and as the measurement is carried out particles are drawn through the orifice. As each particle passes through it displaces the electrolyte and this disturbance changes the resistance between the electrodes, which is measured and is a function of the volume of the particle passing through the orifice.
Beckman Coulter Multisizer 3.
1–200 microns.
1) All particles are spherical; 2) all particles are of the same density.
The particle size can be represented as equivalent spherical diameter, based on volume – this is the diameter of a sphere that has the same volume of the particle being measured.
The HIAC 8000A is used primarily for testing the cleanliness of hydraulic fluid to ISO Standard 4406 and has an overall size range from 1.2µm to 100µm.
Used primarily for testing the cleanliness of hydraulic fluid to ISO Standard 4406.
HIAC 8000A.
1.2–100µm.
Small volume sizes
Image analysis allows us to identify the shape of a particle in addition to counting and sizing them, as well as allowing us to characterise material that previously presented difficulties, such as fibres and needles.
A relatively basic but effective particle size analysis method is by sieve analysis. Particle Technology own a full range of ASTM standardised test sieves and automated sieve shakers. The sieves are selected based on sizes of interest ranging nominally from 20 microns to ~3mm. They are placed with the smallest sieve at the bottom and the sample is added to the top sieve. As the sieve shaker vibrates the sieves at high frequency, the smaller particles pass through the apertures of the sieve onto the next size down, eventually being retained or collected as undersized material. This mass data is used to present the particle size distribution.
Sieves are placed with the smallest sieve at the bottom and the sample added to the top sieve. As the sieve shaker vibrates the sieves at high frequency, the smaller particles pass through the apertures of the sieve onto the next size down, eventually being retained or collected as undersized material.
ASTM standardised test sieves and automated sieve shakers.
20 microns–~3mm.
Mass data is used to present the particle size distribution.
Advantages-Repeatable/no loss of sample. Robust method. Effective for coarser samples.
Disadvantages – Typically sizes particles based on their smallest dimension and so a long particle with a small diameter would be classed as smaller than it would if it was analysed by laser diffraction.
If you require information on the particle size distribution of a dust sample, please get in touch. We can carry out analysis on samples ranging from samples taken of bulk materials for general QC/QA purposes to samples taken during environmental monitoring activities such as stack emissions testing where we can remove and analyse the particulate from the filter provided.
Please contact us for further information.
Want to know more? Please get in touch and let us help you by making particles count.